The Signal from Vector is Noisy
Sources of Noise
Transmission and Acquisition
Analogue-Digital Converter baseline characteristics
Analogue signal scaling
Electrical ground, or earthing
Electrical interference
Measurement
Specimen marking
Operating environment
Vector positioning
Transmission and Acquisition Noise
Types of Noise
Type |
Description |
Example |
Causes |
|---|---|---|---|
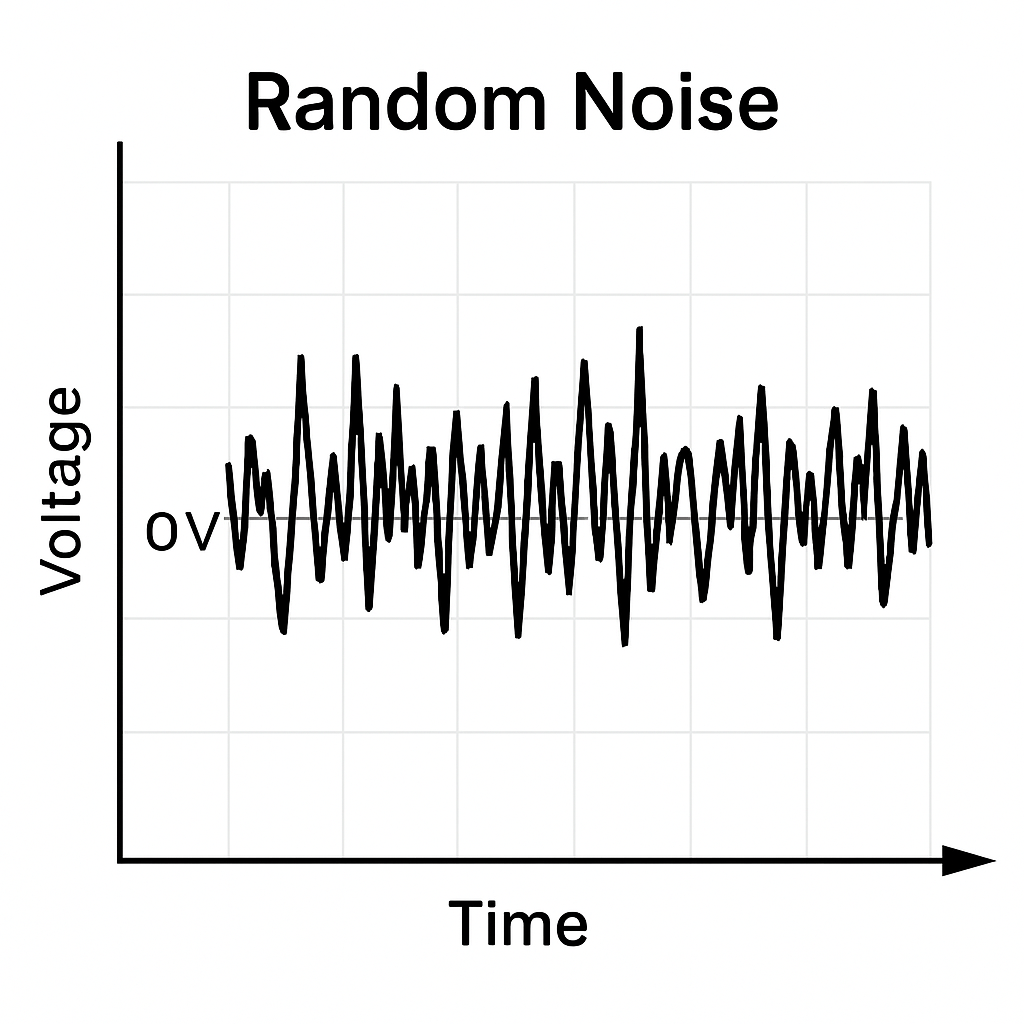
Random |
The high frequency scatter of the signal. A small amount is natural. |
|
Excessive noise is likely interference from a neighbouring high-power machine. |
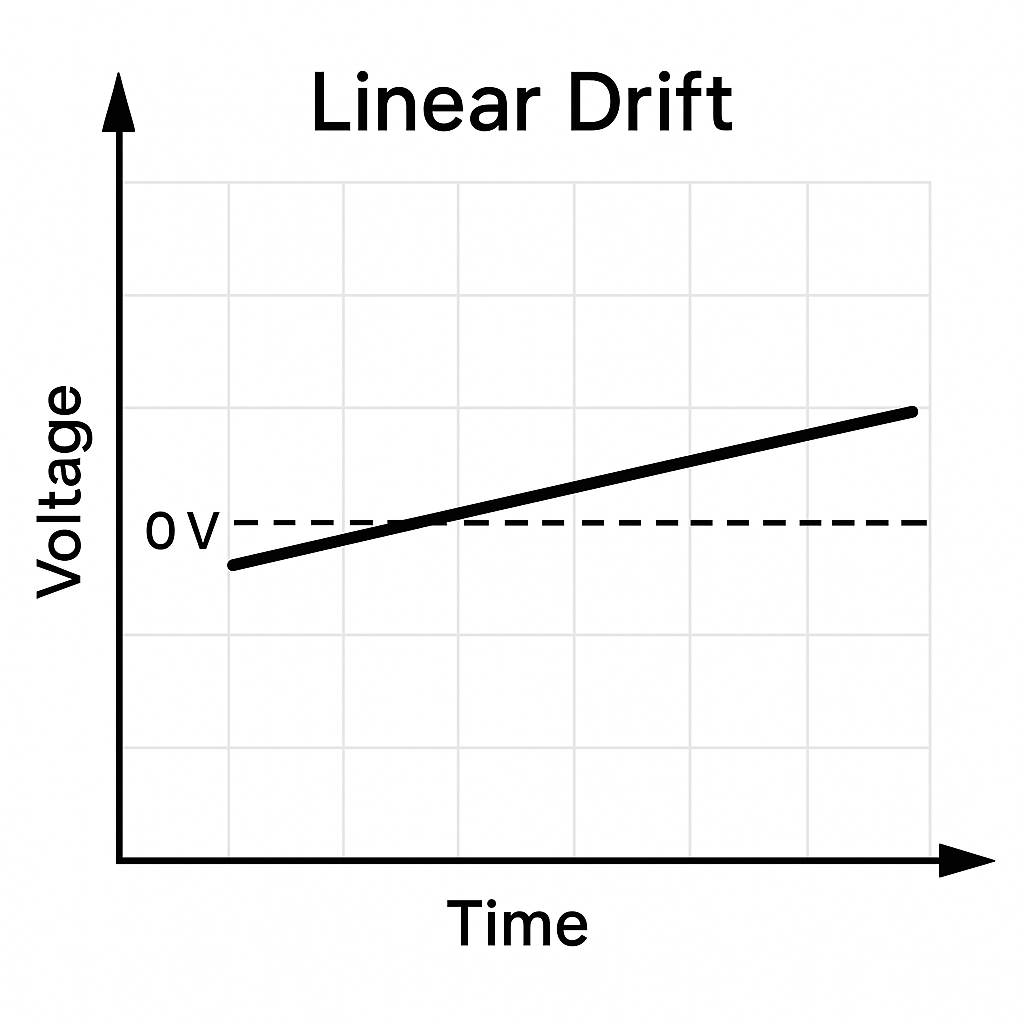
Drift |
The slow trend of a signal from one value to another over multiple seconds. |
|
Drift is likely a grounding issue (”earthing”), between two floating sources. |
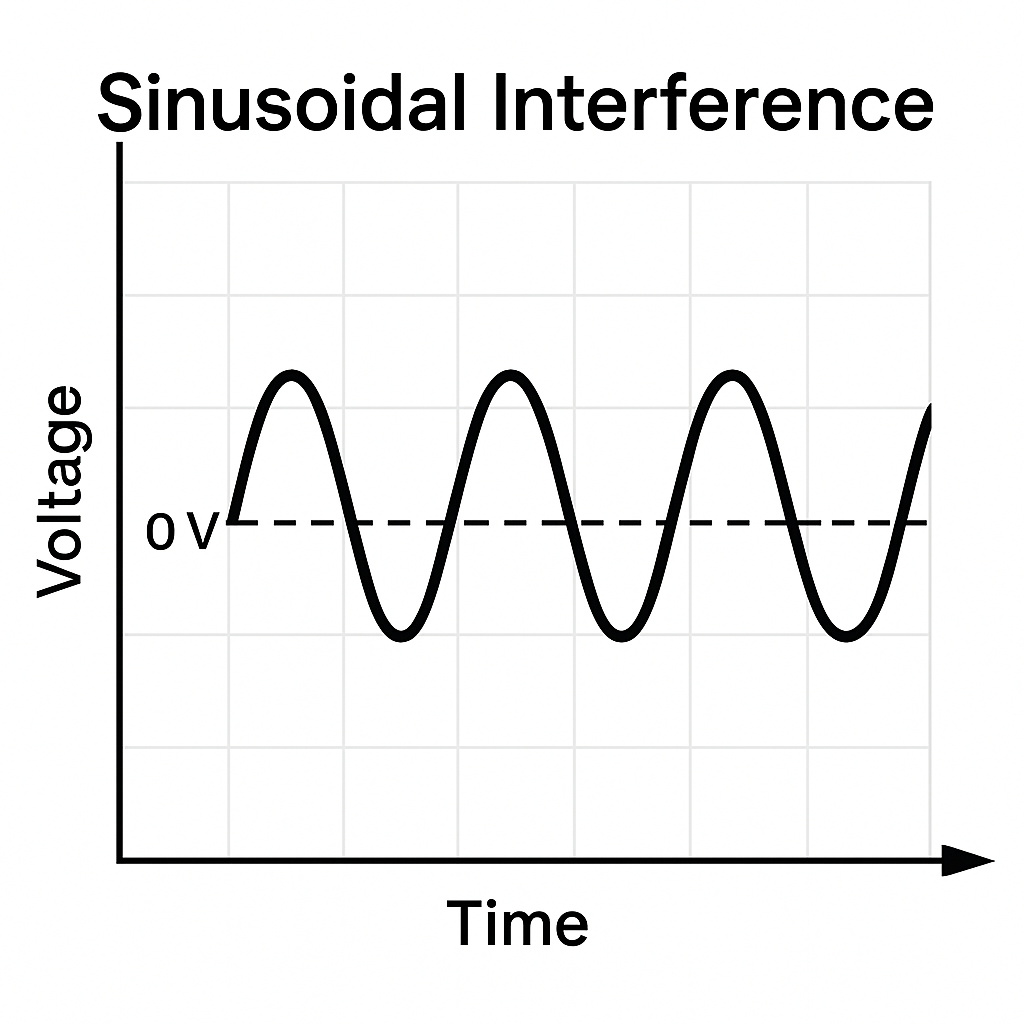
Sinusoidal |
The consistent, periodic fluctuation of the signal multiple times per second. |
|
Periodic noise is likely interference from the mains electric power supply or grounding source. |
Mitigate Random noise
Use shielded cables, such as coax or twisted pair.
Replace cables with shorter lengths, where possible.
Reduce the measurement range to increase the resultant resolution of the signal.
Ensure the range does not vastly exceed the expected minimum and maximum strain for the intended material and test.
Ensure the range includes a 20% margin on both the maximum and minimum.
Note: Check the scale of the Vector analogue output matches the signal input of the test frame.
Increase the signal filtering.
Note: Increased filtering will increase signal latency.
Mitigate Drift
Connect the UTM’s dedicated grounding pin to a local ground and ensure Vector is not directly grounded.

Mitigate Sinusoidal noise
Identify the cycle rate via a plot of Signal vs Time.
Mains electric is 50Hz or 60Hz depending on the region.Use shielded signal cables, such as coax or shielded twisted pair.
Replace cables with shorter lengths, where possible.
Route signal cables away from mains cables, power cabinets, and high power machinery.
Connect the UTM’s dedicated grounding pin to a local ground and ensure Vector is not directly grounded.
Solutions for Transmission Noise
Measurement Noise
Solutions for Measurement Noise
Check the markings have been applied correctly.
Poor markings can introduce noise, especially if the specimen has not been correctly prepared. Ensure the specimen is free from grease or dust before marking. | See section on Specimen Marking for more information.Check markings are suitable.
When measuring transverse strain, rings are recommended for flat specimens.See section on Specimen Marking for more information.Inspect the History page to view any scanning and measurement warnings.
Warning indicators highlight issues with the setup. Poor positioning may be producing poor behaviour. The history page is found on the Vector Interface app. See section Measurement History. | Warning indicators are visible live during Scanning on the Vector Interface app. See section Scanning Overlays and Dashboard.Allow 20 minutes for the Vector to reach stable and valid operating temperature.
Vector is calibrated to measure in stable laboratory conditions, within 18-22°C. Measurements undertaken recently after startup can exhibit noise or drift. | Dissimilar storage conditions can affect this warm-up period.
Process for Detailed Assessment
Acquisition
Prepare the UTM
Configure the scaling of the analogue input to be equal in units to volts. Confirm the scaling is correct. I.e.:
Min = -10V = -10 %
Max = +10V = +10 %
Set up a test method that records strain against time with no cross-head movement.
Remove any specimens for the grips.
Remove any connections to the analogue input, including Vector and any cables.
Connect the UTM’s dedicated grounding pin to a local ground and ensure Vector is not directly grounded.
Perform a short test, no more than 60 seconds without Vector connected to the UTM:
Test 1 - the isolated acquisition resolution.
The test contains a signal at 0% (0V)
Identify the source and type of noise.
Inspect Test 1 by plotting input signal vs time. Exporting the data via .csv may be convenient.Identify the Signal to Noise Ratio.Identify the largest typical positive peak of noise in the signal.
Identify the largest typical negative peak of noise in the signal.
Equate the maximum peak-peak noise of the signal by subtracting the negaive peak from the positive peak.
Divide the maximum peak-peak noise by the maximum signal (10% = 10V) to produce the signal to noise ratio.
The Signal to Noise Ratio should be at least 1 in 64,000.A small amount of noise is acceptable and to be expected.
Transmission
Prepare Vector:
Connect Vector to the UTM.
Place Vector in Scanning mode.
Configure the scaling of the analogue output to also be equal in units to volts. Confirm the scaling is correct. I.e.:
Min = -10V = -10 %
Max = +10V = +10 %
Perform a short test, no more than 60 seconds with Vector connected in Scanning mode:
Test 2 - the acquisition and transmission resolution.
Identify the source and type of noise.
Inspect Test 2 by plotting input signal vs time. Exporting the data via .csv may be convenient.Scrutinise for behaviour and trends. Are drifting or sinusoidal behaviours present?Again, identify the Signal to Noise Ratio as described above.The Signal to Noise Ratio should be at least 1 in 40,000.
Measurement
Prepare the test:
Mark and mount a specimen in the grips.
Position Vector to begin measuring.
Ensure the arrangement is of a stationary specimen that is not straining.
Perform a short test, no more than 60 seconds with Vector connected in Scanning mode:
Test 3 - the full system noise.
Identify the source and type of noise.
Inspect Test 3 by plotting input signal vs time. Exporting the data via .csv may be convenient.Again, identify the Signal to Noise Ratio as described above.The Signal to Noise Ratio should be at least 1 in 20,000.If the level of noise present when Vector is measuring worse than 1 in 20,000, see section Measurement Noise.